(This is part of an ongoing discussion of the 2018 OSR Survey results. See the table of contents at the bottom of this post for links to the other parts.)
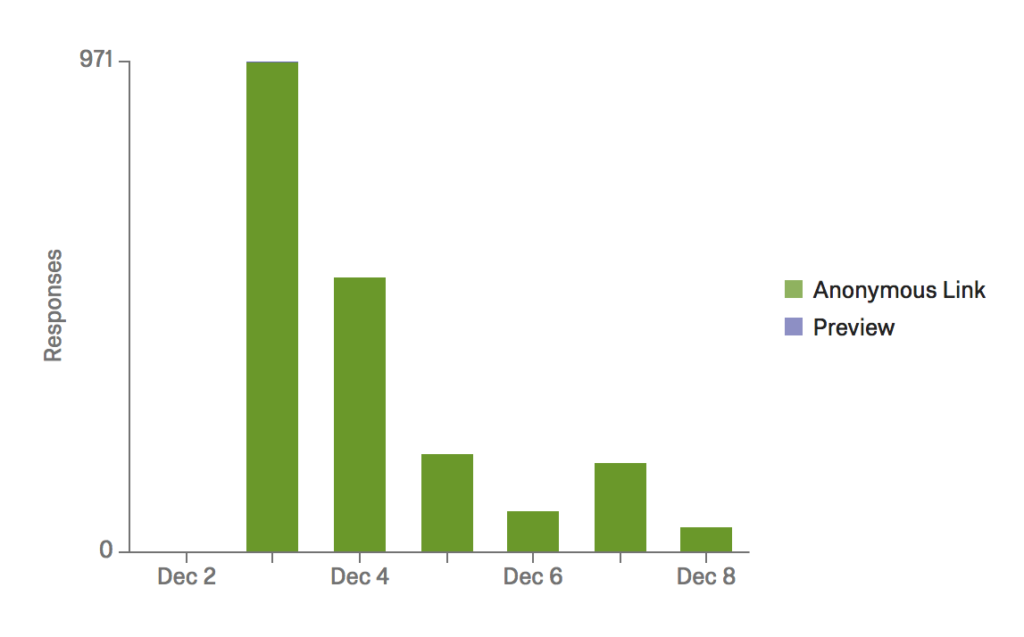
This is the first post of several where I will summarize the results of the OSR survey Ben and I ran. The survey was open from December 3rd through December 8th (2018). Given the high level of participation, and a handful of common critiques, after I have a chance to post some results I plan to ask for general feedback about how we ran the survey and what people might like to see in the future. For those who want a short summary, the TLDR of this post is that there were 2000+ responses (that is a lot), mostly from North America/Europe, and some basic demographics (such as age and country of residence) are similar for OSR participants and non-participants (based on self-categorization).
Purpose
 A few people asked why we were running the survey at all. The superficial (but true) answer is that I saw Ben post a question on Google Plus about what questions people might like to see on a hypothetical OSR survey. I was curious too, and I have some experience running surveys so I reached out, and here we are. The slightly more involved (and also true) answer is that I have been, over the last several years, continually surprised by seeming confusion, misunderstanding, and disagreement surrounding the meanings that people attach to the term OSR. Personally, I am primarily curious about the degree to which there is consensus about this meaning, whether the meaning differs substantially between people that consider themselves to be participating in (the?) OSR, and whether the meaning people currently see matches what they would like. Secondarily, I am also curious about what content (at the game level) people consider OSR, the geographical distribution of people that participate in (the?) OSR, and favorite OSR products. Other questions may occur to me as I proceed (and feel free to suggest questions if you have any).
Responses
2018 respondents completed the survey (that serendipitous number is a coincidence). Based on some preliminary checks, I see no sign of brigading, bots, or similar threats to data quality. 134 responses failed the attention check near the end. 46 responses provided age greater than 100 and one response gave age less than 10. 9 respondents specified that I should discard their response entirely. None of these responses will contribute to my summaries. After exclusion, there were 1,828 responses. To the question Do you participate in the OSR?, 1450 respondents said Yes, 372 respondents said No, and 6 skipped the question.
Generalizability
Several people seemed suspicious about why we asked any demographic questions. The point of such questions is have some basis from which to generalize the results. For example, if respondents skew older, it would be inappropriate to assume results represent the beliefs of younger players. And so forth. Additionally, many people indicated, both to me directly and in the final “share anything” question, that they found the two items about political orientation insufficient to accurately communicate beliefs. Due to this feedback, and to ease concerns that there is some prior political agenda motivating the survey, we decided to avoid looking at those measures. Most obviously, these results speak more to the beliefs about people who talk about games online. Only people who frequent RPG forums or follow people who talk about RPGs on social media are likely to have heard about the survey at all, so that is a property of the sampling process. Put another way, we oversampled (heavily, perhaps close to exclusively) people who spend large amounts of time on hobbies online. That is, however, appropriate to OSR, which originated and developed online.
Figures
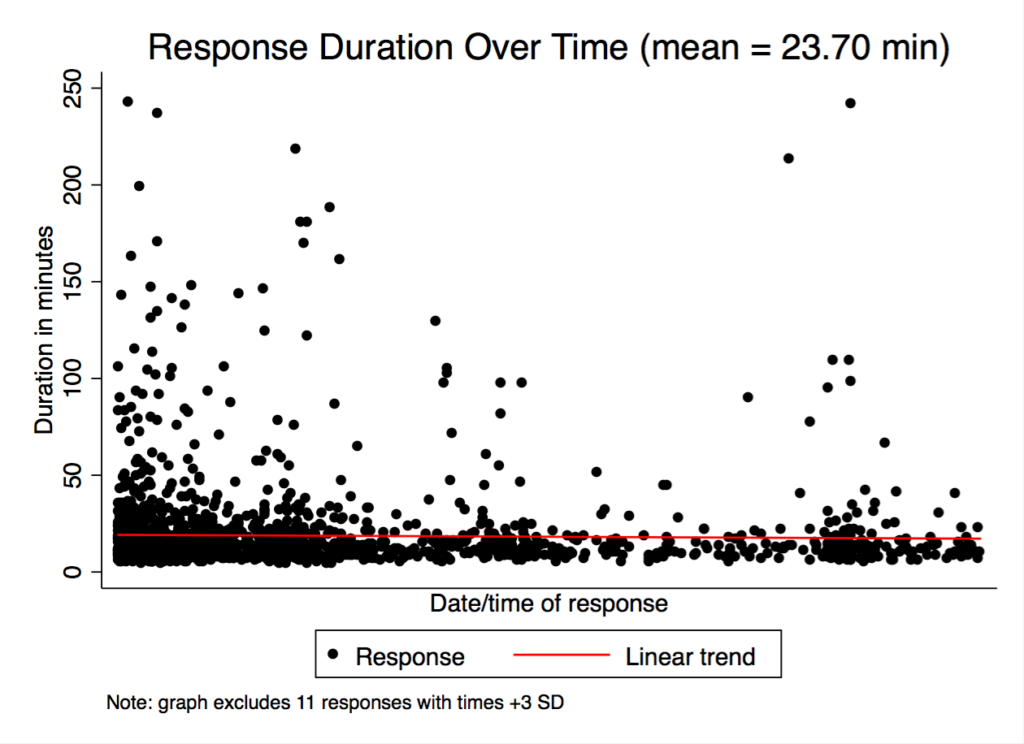
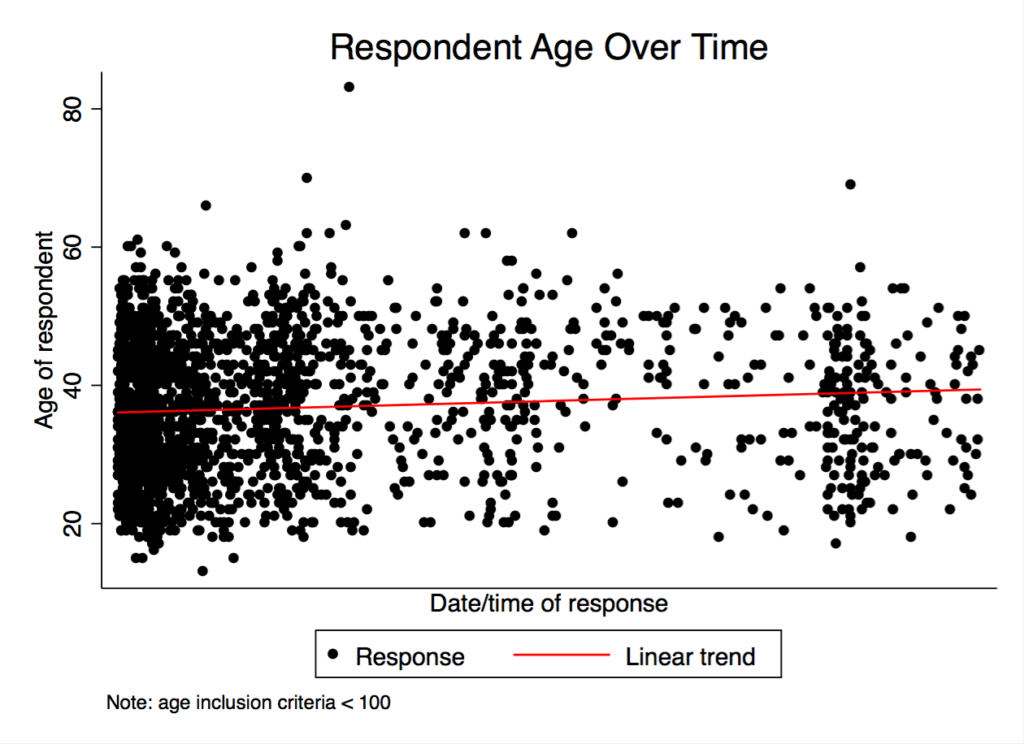
The first two figures show scatter plots of responses over time. The first plot shows how long participants took to answer the survey, in minutes. For ease of visual interpretation, I avoided plotting a handful of observations where respondents took an extra-long amount of time to submit the survey, though these responses still contribute to other results. The second plot shows respondent age, which drifts very slightly up according to the trend over time, though it is difficult to see. Plots such as these often show potential confounds or technical errors. Nothing like that jumps out at me.
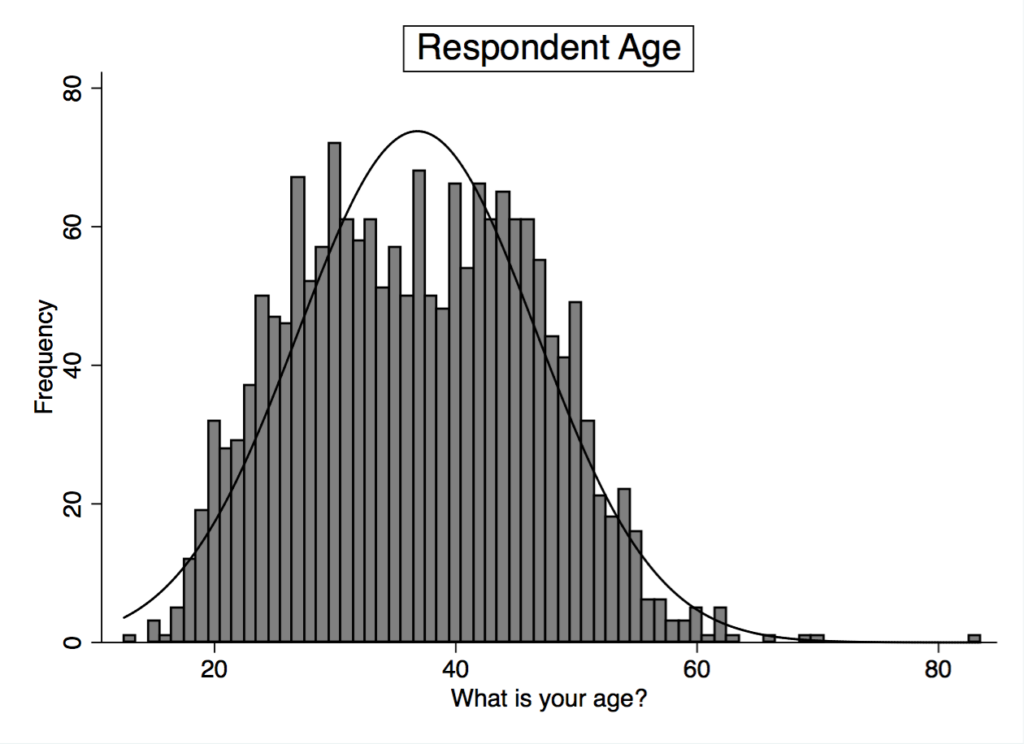
The mean response age was 36.81 (SD = 9.88, n = 1828) and the stats are similar for self-declared OSR participants (Mage = 36.58, SD = 9.87, n = 1450) and self-declared OSR non-participants (Mage = 37.64, SD = 9.90, n = 372).
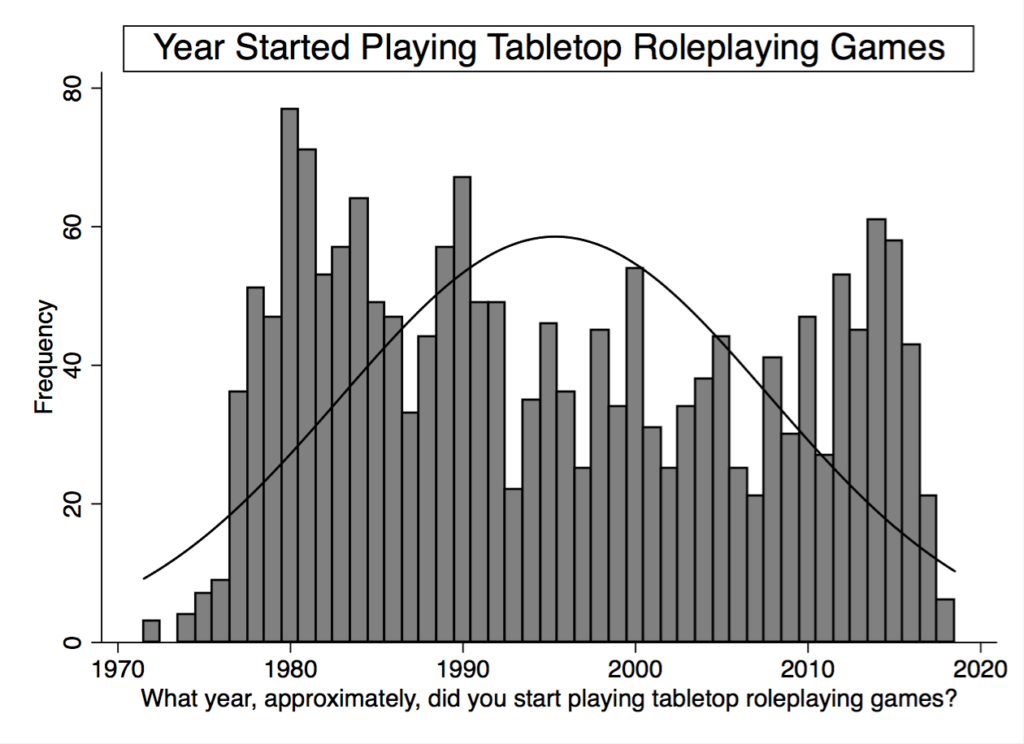
There was a mix of people that have been playing tabletop roleplaying games for a while and people that started more recently. My guess is that the frequencies by year shown below approximately reflect general industry fortunes.
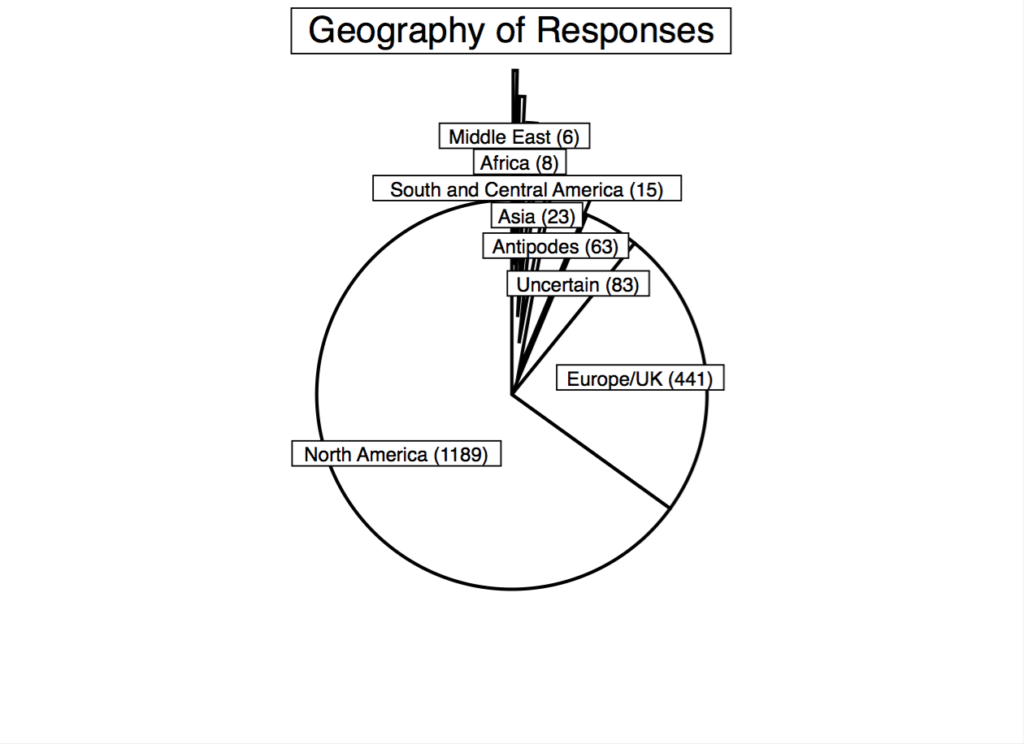
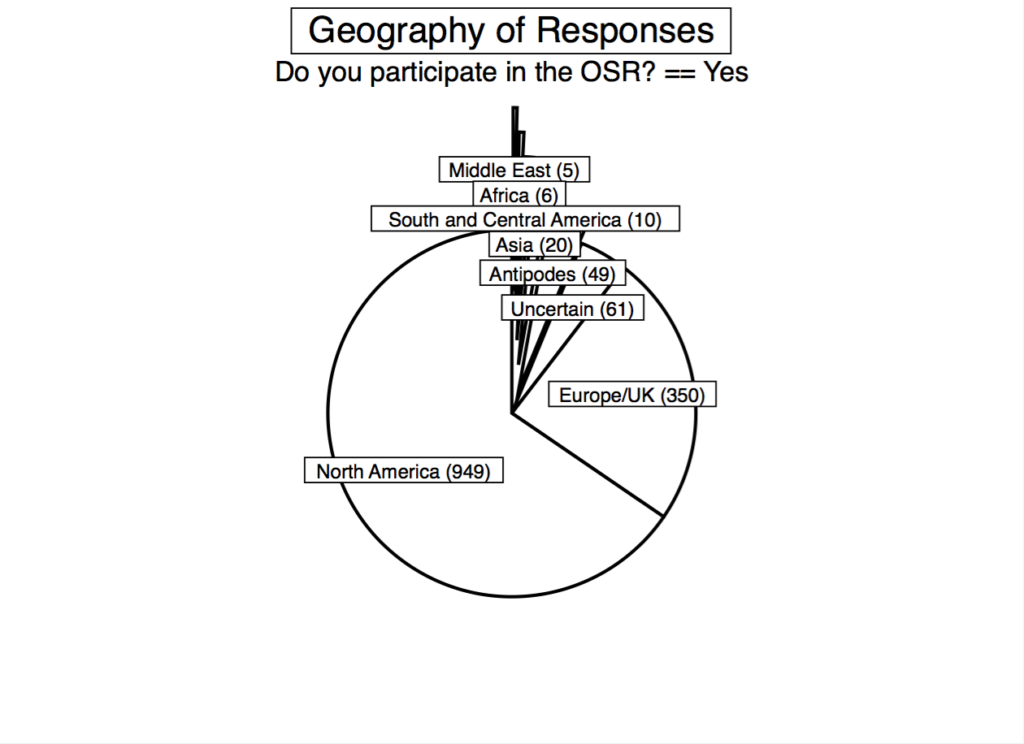
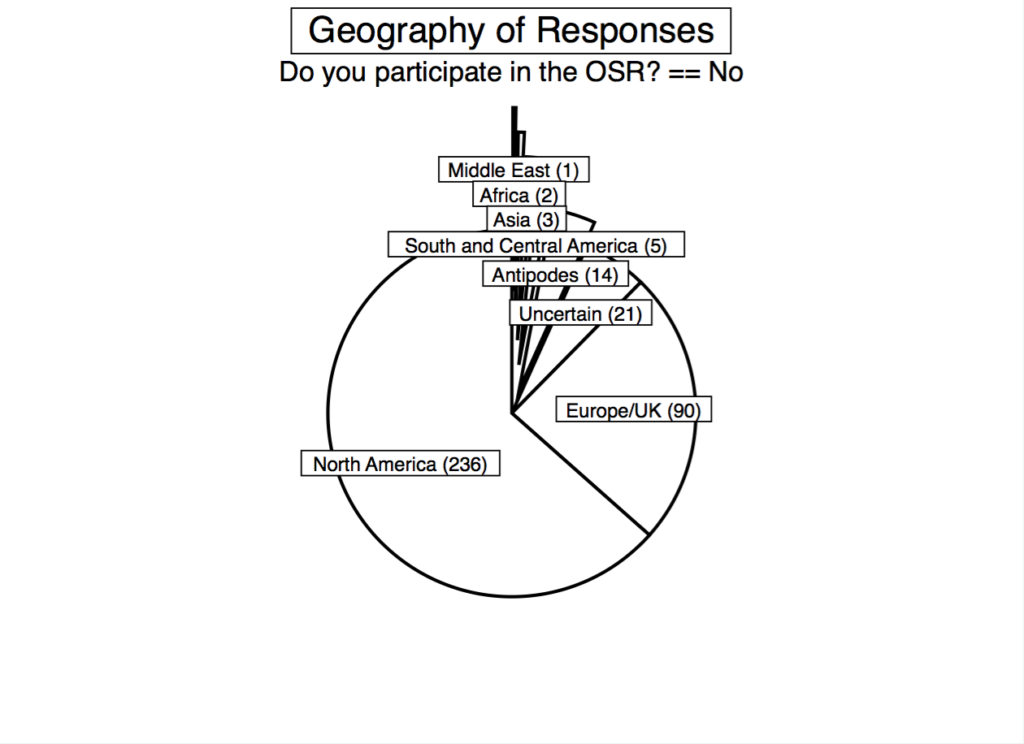
I categorized responses by rough geographic area based on country of residence. Yes, I know that “Asia” is an oversimplification, but look at the number of responses before you object. Participants that skipped the country item, or responses that were ambiguous to me, show up in the “Uncertain” category (as in, I am uncertain). The majority of responses are, unsurprisingly, from North America (65%), and 89% are from North America plus Europe combined (being relatively expansive about the definition of Europe). So when you are thinking about what kinds of conclusions you can draw from these results, keep that in mind. This survey should give a decently representative picture of people from North America and Europe who talk about tabletop roleplaying games online, but speak less to players living in other cultures.
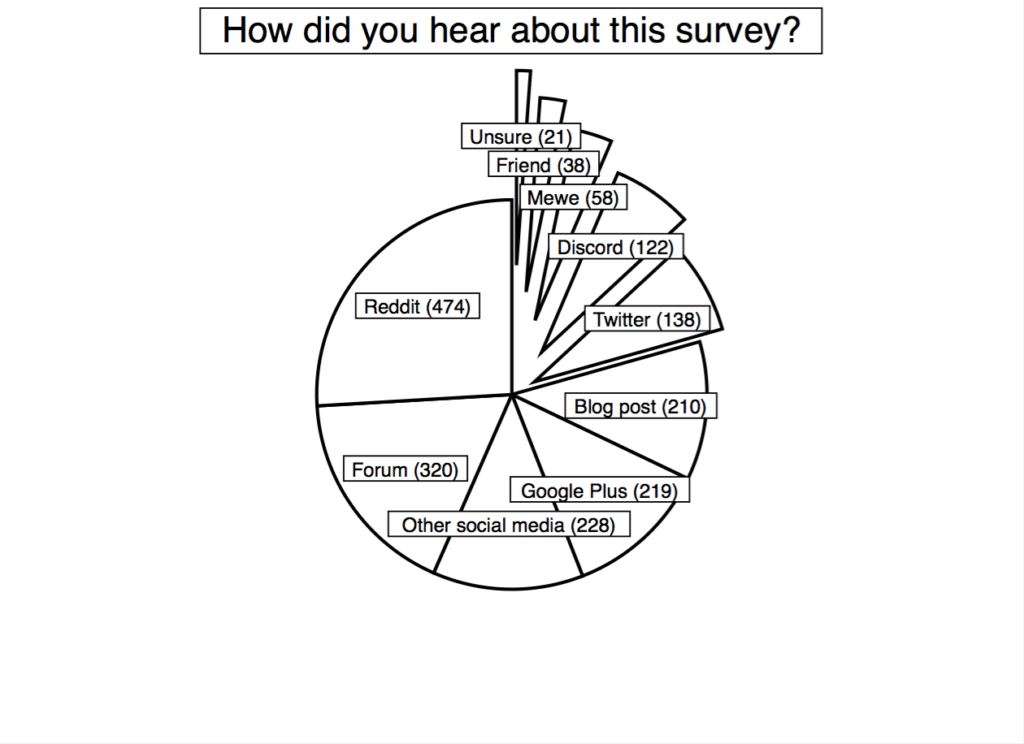
The social media context in which people reside may be even more important, for purposes of measuring beliefs about OSR, than physical geography. Respondents indicated where they heard about the survey, and that seems like a reasonable, if imperfect, proxy for social media environment. The immediate takeaway here is that Reddit is huge. The secondary takeaway is that the survey represents a much wider swath of RPG players than those that I hang around, as my crowd is mostly on Google Plus and blogs at the moment. We also asked people about how often they used various platforms for talking about games, but I think that is enough for now.

Awesome, this is just the kind of statistical analysis that I was hoping for when I worked through the questions. Can’t wait to see what information can be gained from the full set of data.
That big dip in people in their late 30s seems very fascinating. That’s a bit older than me, so people who were around 18-20 in 2000, when D&D 3rd Edition came out. I wonder if there’s a correlation, but getting information about people who didn’t participate from the data might not be possible.
Do you know what happened on the 7th to make the number of responses surge up again?
Friday night when they couldn’t get a game together maybe?
@Yora
I posted a reminder on Google Plus about the survey on the 7th, along with a note that I would be closing the survey on Saturday. Ben also reshared that post, so my guess is that reminder was responsible for the bump.
Kids? I’ve found a lot of parents don’t get the opportunity to play much whilst kids are between certain ages.
@Ian Borchardt
Oh, yes; that is a good point. I wish I would have asked some questions about family situation. Next time.
Just marvelous. Nothing jumps out at me as strange yet but I love the way you present your data. Thank you. Looking forward to the rest of the data.
Can I say here how much I hate Google Plus and Mewe. So many things get said and missed by that I feel as if I’m in a bar trying to pay attention to so many different conversations. Blog posts and forums seem so much better to me to keep a record of conversations. I’d love to know why there was such a migration away from those.
@jasperak
I suspect that no matter what kind of platform one prefers, there is more content than one can follow. I find forums to be somewhat harder to keep up with because I need to visit them individually, and so each one feels like another inbox to check. Central moderation also creates some problems, so all else equal I would probably prefer a more peer to peer architecture where people follow each other directly rather than post to what is essentially a shared feed under the control of some central authority. Google Plus worked pretty well for me, but honestly I think social media platforms (including forums) depend more on who is participating than on any other properties of the platform, similar to how killer apps or games make operating systems or game consoles attractive. Mewe is currently less flexible than Google Plus and also lacks critical mass, from my perspective.
Thanks for doing all this work.
Never having been to google plus, I actually wonder if the majority of the OSR sphere has just turned invisible or has vanished. From the outside it looks like most content creators have almost ceased to show any new creations, or have disappeared completely.
Though I think that since the closing of google plus was announced, there seems to be a slight increase in some veterans’ posting.
@Yora
I suspect there are two major forces at play here. First, walled gardens such as Google Plus and Facebook pulled some engagement and attention away from blogs. Second, some people who in the past focused more on blog or other kinds of Internet-shared content turned effort toward publishing content more formally. I will be curious to see if the uptick in blog activity persists, especially when Google Plus actually closes.
A few weeks ago, based on some input from people on Google Plus, I put together a list of favorite OSR or OSR-adjacent products which came out during 2018, which I included below (the items are in no particular order and I am sure the list is incomplete). This seems like substantial output.
I love social surveys like this, so thanks for putting the effort and sharing. Do have any plans to slice the data up? A few things that I would be interested in seeing:
* years playing TTRPGs (from the year started playing)
* crosstabs or scatterplots of two questions, especially combinations of age, year started, years playing, OSR or not.
@Matthew
Yes; you can expect several more posts with results.
Let me know if you think of other questions that the data may be able to shed light on.
Thank you for doing this, this is really fascinating! I did a survey back in 2009 as to why people switched to retroclones or OSR games. I have the old blog post and data stashed in an archive, if you’re curious. I don’t know if it will line up with any of your data, but you might find it interesting. I can email you the old posts, if you want.
@Chgowiz
Yeah I am curious about your results. You can find my email address in the “About” tab linked from the blog header.
(Tangentially, thanks for those sandbox prep myth posts you wrote way back when. I found them quite helpful back when I was first exploring OSR approaches.)
Gotta say I’m curious to hear more about the 85 year old gamer.
I’m just as curious about the one who’s under ten. Unsure if they’re just taking the piss or if we’ve actually got young kids playing AD&D.
@Emmy
I just checked out the response that provided age < 10 (age given was 1). That person provided implausible info (selected both male and female, started playing in 1950, and so forth). The free response answers are not totally incomprehensible, but it seems likely that this particular respondent was being generally insincere. (I avoided looking at any responses prior to applying the exclusion criteria described in this post, but now that I look at this one, it seems like dropping this response was no big loss.)
@ruprecht
I can tell you: that respondent plays AD&D, has been playing a long time, is a self-declared non-participant of the OSR, and heard about the survey on a forum.
Hey! I’m a data nut and I love the idea of pie charts as much as everyone else but they’re more or less completely eliminated from modern data analysis because they’re not actually very easy to understand. A bar graph works better 99% of the time. Just something to consider.
Thanks for all the work!
@Thomas M
Glad to hear the results are useful.
Bar charts are often more appropriate, but the benefit of a pie chart is that it makes clear the mutually exclusive nature of category membership. For variables such as country of residence and referral source, pie charts more effectively communicate the data pattern.
That said, let me know if you would like to see any distribution or relationship presented in a different graphical manner, as I can make most kinds of figures relatively easily, and different ways of presentation work better for different people.
Pingback: CAR-PGa NEWSLETTER Vol. 28, No. 1 January 2019 – CAR-PGA
Pingback: Webwatch #8 - PnPnews.de